Ancient Weights: 2 Cultures
by
Chandrakant Doshi
Key words: weights, ancient, Harappan, Indus, Mesopotamian, Ur, Nippur, Mohenjo Daro, Dholavira, stone, chert, hematite.
Mesopotamian and Harappan civilizations both had their own weight systems. This note examines these systems, recognising that the recovered weights from each site are a mix of two grades of weights (details below), one accurate and one less so and demonstrates that the accurate grades from these bronze age cultures have similar accuracy. These two grades will be referred to here as Class A and Class B weights, specimens of Class A being the more accurate of the two Classes.
For this analysis weights from Mohenjo Daro1, Dholavira2, Nippur3 and Ur4 are used. In all these weight collections the details of the materials of weights are available. This is important, as it will become clear further down.
Harappan weights were first analysed by A. S. Hemmy in late 1920s and he noted the difference in accuracy of weights of different materials when analysing Mohenjo Daro specimens.
“The weights not made of chert are on the whole not so accurate as those that are”, he wrote in Further Excavations at Mohenjo Daro1, (MjD FEM), page 605.
“The weights not made of chert are on the whole not so accurate as those that are”, he wrote in Further Excavations at Mohenjo Daro1, (MjD FEM), page 605.
A. S. Hemmy5 also analysed weight systems of the Harappan and Mesopotamian civilizations and concluded that the Harappan weights were by far the more accurate of the two. For comparison, Hemmy used Mohenjo Daro weights on the one hand and a collection of weights from Ur and Susa on the other. No references were given for the sources of these data. But he did observe that
“In the Indus system, the great majority conform to one standard (13.625 gm or 210.2 gr.), and may be divided into two grades, one very accurate, one much less so.”
W. B. Hafford6 also noted two different grades in the weight collection from Nippur:
“Were the well-made hematite and bronze pieces the official or royal weights used by an upper echelon of merchants and bureaucrats, while the crude types of less dense stone and less regular form were those of the more local people?”
When a wide range of values need to be displayed on a chart then converting each number that represents the weight of a specimen to its logarithm makes it possible to display it on a standard size chart. Such a chart is referred to as a log chart. Logarithm or log of a number is expressed with respect to another number, called the base. Commonly used base is 10. Charts used here are all to base 2, which has the advantage that values which are halves or doubles of another value have log values that differ by 1. Since most weight systems have values which are halves or doubles of previous values, specially at the lower end, then the choice of 2 is an advantage. With suitably scaled axis, this is easily seen. Divergence from the binary scale also shows clearly. And the use of 2 as a base provides a better resolution.
To prepare this special chart, the weight list is sorted by the material of the specimens and for each material, by the value of the specimens, lowest value first. The numerical value of each weight is converted to log to base 2. These log values are then plotted on a chart. As can be seen in the accompanying charts, vertical axis represents log(W) while the horizontal axis represents the item number on the list. The vertical axis is suitably adjusted to have the value of the unit weight fall on a grid line.
An examination of the chart reveals that for one material the display is a staircase ( implying many specimens are close together in value) while for the rest of the materials, the display comprises of mostly scattered points, with no systematic structure evident. A full sequence of specimens of this single material, from the lowest value to the highest, is present in the collection. This is not the case for the rest of the materials.
Chart D below displays these weights from Dholavira arranged in alphabetical order by material and within each material by numerical order, lowest first. Weights made of chert are over-plotted in red and shows the typical staircase representing a weight system. The flats are made by a large number of specimens close in value. Some of the other materials also show a few specimens on a flat but generally there are few specimens that make up the flat and the range of nominal values covered by the staircase is rather small. So, there are indeed two grades of weights present in the recovered collection from Dholavira.


There are two papers by W. B. Hafford available online and which include a list of weights from the Mesopotamian sites of Ur2 and Nippur3. Each list includes, besides the weight of the specimen, the material it is made of, the shape, ratio of the specimen and the derived unit of the system. Charts for each of these two weight lists, along similar line to Chart D reveal two grades of weights in each. Hematite, a hard stone, is the material for one of the grades of weights and is over-plotted in red in the charts below. This can be seen in Chart 1 for Ur and Chart 2 for Nippur.
Mesopotamian weights are scattered across various museums and institutions and Hafford has put considerable effort to collect them together. As he notes, there are many more of these in the museums in Iraq which were not accessible to him.


Looking at the four charts above it is clear that weight collection from each site can be separated into two categories. The criteria that partitions these weights is the type of stone used in manufacturing them: chert for Harappan weights and hematite for Mesopotamian weights. Both of these are hard stones and the weights made of these materials are referred to as Class A weights. To establish that these Class A weights are the more accurate of the collection, we need to examine their frequency distribution charts.
A frequency distribution chart displays the number of specimens in a given interval of weight. Easiest way to achieve this is to normalise the whole weight list first. Each specimen allocated to a ratio or nominal weight is divided by that nominal weight. A specimen weighing exactly the nominal weight will return a value of 1.00, while values below or above the nominal value will return a value less than or greater than 1.00, respectively.
The range of normalised values is divided into intervals of 0.01, starting with the interval at the nominal value. This is symmetrically arranged about it, so the interval covers the range 0.995 to 1.005 of the normalised value. The entire range of the normalised values is similarly covered.
The frequency distribution is the number of weight specimens occurring within any given interval. A plot of these numbers is the frequency distribution of that weight system. These distributions are based on a unit weight of 13.625 grams for the Harappan system and 8.40 grams for the Mesopotamian system.
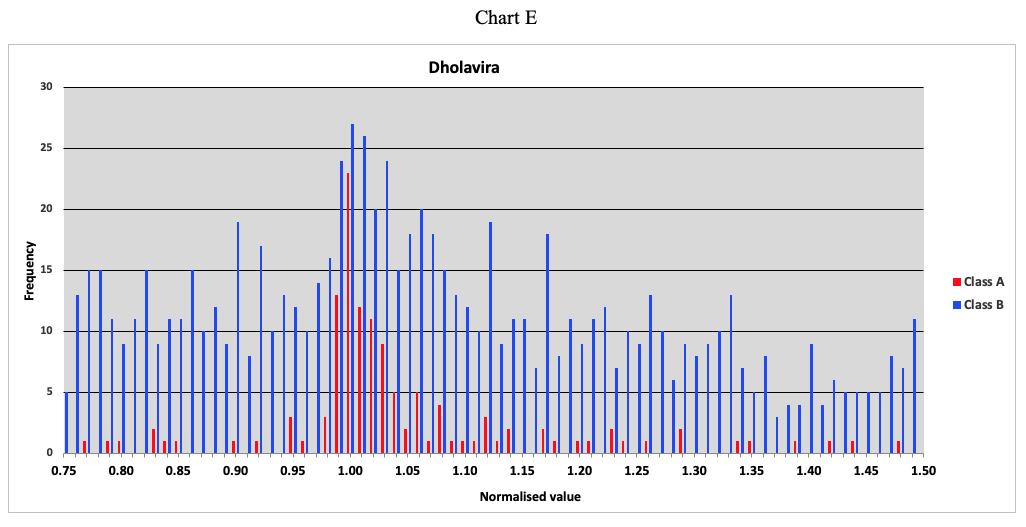
The plots display the distribution of Class A and Class B weights on the same chart for each of the four sites. The Harappan weights, Chart B and Chart E show the peak frequency for Class A at the normalised value of 1.00. Very few of Class B specimens are present in Chart B whereas very large number are present in Chart E.
Among the Mesopotamian weights, the peak of Class A weights at Ur (Chart 3) occurs at the normalised value of 0.97 with the frequency at normalised value of 1.00 is only slightly lower and is the second highest peak in the distribution. For Nippur the peak for Class A weights does occur at the normalised value of 1.00.


An examination of the frequency distribution of Class B weights from the four sites show that they differ widely. This would support the view that many of these were made by individuals for the activity they were engaged in, such as mixing spices, medicinal products or alloys like bronze.
The frequency distribution of Class B weights from MjD FEM is hardly distinguishable from that of Class A material (Chart B). This was the only Harappan weight collection with material data available to Hemmy when he first analysed weights from this culture. It is no surprise therefore at the conclusion he reached, knowing the chert weights were more accurate than other materials. None of the Harappan weights he subsequently analysed had material information recorded.
Frequency distribution presents a qualitative picture of the weight system. Standard deviation would represent a quantitative measure of a weight system. A normalised value of a weight specimen represents its deviation from its nominal weight, which has a normalised value of 1.00. The whole list of normalised values of a system can be used to calculate the standard deviation of that collection.
In Table 1 below are listed standard deviations of weights from 4 sites under 2 headings. Class (A + B) specimens are a mix of all the materials whereas Class A specimens are made of only a specific stone, different for each culture.

Standard deviations of MjD FEM, Nippur and Ur are close in value for Class A collection of weights. Compare this with the same for Class (A + B). This clearly demonstrates that Class A specimens, made of hard stone, are the officially authorised weights. All the others should be considered unauthorised specimens, made of different materials and may not have been closely calibrated to the authorised specimens. A mixture of these two sources of weights do not correctly reflect the accuracy of weight systems of each culture.
Dholavira weights present a unique picture. First the whole collection needs to be separated into 3 different standards R. S. Bisht has identified. Only then the weights of Harappan standard can be examined. As it is, the Class A weights have their peak at the normalised value of 1.00 but the distribution is not symmetrical about it.
More weight data from new sites in both cultures need to be examined to see if they support the view that the Class A weights have similar accuracy in both these cultures. In that respect Dholavira weights need to be re-examined. W. B. Hafford has collected new Mesopotamian weight material (email, 15 August, 2019) that he is examining, and it would be interesting to see how the result of this new material fits with the scheme described above.
The analysis presented here demonstrates that both Harappan and Mesopotamian civilisations had achieved similar accuracy with their weight systems. It was the mix of two grades of weights that masked the true accuracy of the Mesopotamian weight system. It may be that this mix of two grades of weights was a general practice among these two as well as other cultures.
References:
1/ Further Excavations at Mohenjo Daro, Ernest Mackay (1938), pp 603
2/ Dholavira Excavation Report - R. S. Bisht (2015). This is available online and can be accessed here: http://asi.nic.in/pdf_d…/dholavira_excavation_report_new.pdf
3/ Balance Pan Weights from Nippur by W. B. Hafford
4/ The Balance Pan Weights from Ur by William B. Hafford, in Akkadica 133 (2012)
5/ The Statistical Treatment of Ancient Weights by A. S. Hemmy, Ancient Egypt, December 1935 pp 83
6/ Balance Pan Weights from Nippur by W. B. Hafford: page 34
© 2020 Chandrakant Doshi
*
*
*